How Do I Create A Frequency Polygon In SPSS Step By Step
Creating a frequency polygon in SPSS is simpler than most people think. This guide walks you through every step, from preparing your data to customizing the final chart. You will learn how to use SPSS chart builder, set class intervals, and format your frequency polygon in SPSS like a pro.
If you have ever stared at a spreadsheet full of numbers and thought, “There has to be a better way to see what this data is telling me,” you are not alone. A frequency polygon in SPSS is one of the best ways to turn raw numbers into a clear visual story. It shows how often values fall into certain ranges, and it connects those points with a smooth line. The result is a graph that is easy to read and even easier to share.
Whether you are a student working on a research project or a professional analyzing survey results, knowing how to build this chart in SPSS gives you a real edge. SPSS is one of the most popular tools for data visualization and descriptive statistics. Once you learn the basics, you will find yourself using this skill again and again.
In this guide, we will walk through every single step. You will learn what a frequency polygon is, how to set up your data correctly, and exactly how to create the chart inside SPSS. We will also cover formatting tips, common mistakes, and ways to make your graphs look polished and professional. Let us get started.
Key Takeaways
- Easy Process: Building a frequency polygon in SPSS takes just a few clicks once your data is ready.
- Chart Builder Is Key: The SPSS Chart Builder tool makes graphing fast and intuitive for all skill levels.
- Data Prep Matters: Properly organizing grouped data and class intervals ensures accurate results.
- Customization Options: You can change line styles, colors, axis labels, and more to make your chart clear.
- Frequency Polygons vs Histograms: Both are useful, but polygons make trends and comparisons easier to read.
- Avoid Common Errors: Skipping midpoints or mislabeling axes are the top mistakes users make.
- Practice Makes Perfect: The more you work with SPSS charts, the better your data visualization skills become.
📑 Table of Contents
- What Is A Frequency Polygon And Why Should You Care?
- Getting Your Data Ready In SPSS
- Step-by-Step: How Do I Create A Frequency Polygon In SPSS
- Customizing And Formatting Your Polygon
- Comparing Frequency Polygons With Histograms In SPSS
- Common Mistakes To Avoid
- Expert Tips For Better SPSS Charts
- Conclusion
What Is A Frequency Polygon And Why Should You Care?
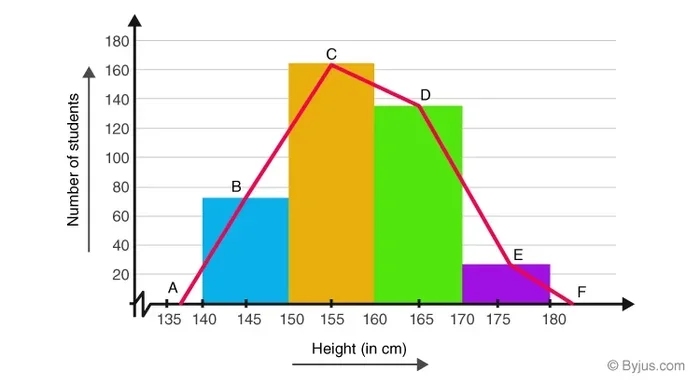
A frequency polygon is a type of statistical graph that displays how often different values appear in a data set. Instead of drawing bars like a histogram does, a frequency polygon uses points connected by straight lines. This makes it easy to see patterns, trends, and shifts in your frequency distribution.
Here is why a frequency polygon is so useful:
- Clear Visual Trends: You can spot where most of your data clusters or where gaps exist.
- Easy Comparisons: You can overlay two or more polygons to compare different groups side by side.
- Works With Grouped Data: It is perfect for data that has been organized into class intervals.
- Professional Look: Frequency polygons look clean and are often preferred in academic papers and reports.
Frequency Polygon vs Histogram
Both charts show the same underlying information. A histogram uses bars to represent frequencies. A frequency polygon uses a line. The polygon sits on top of the histogram or stands alone. Many people prefer the polygon because it takes up less visual space and makes it easy to compare multiple data sets on one graph.
When you are working with ordinal data or continuous variables, a frequency polygon in SPSS is often the better choice. It highlights the shape of the normal distribution and makes the cumulative frequency trend easy to spot.
Getting Your Data Ready In SPSS
Before you build any graph, you need to make sure your data is set up correctly. This step is the foundation of everything that follows. If your data is messy, your chart will be misleading. Take the time to get this right.
Organizing Your Variables
Open SPSS and look at the variable view at the bottom of the screen. Each column represents a variable. Make sure your variable names are clear and descriptive. For example, if you are analyzing test scores, name the variable something like “TestScore” instead of just “X.”
Next, switch to the data view. Each row represents one case or observation. Enter your raw data here. If you are working with grouped data, you will need a second column for the midpoints of each class interval.
Creating A Frequency Table
SPSS can generate a frequency table automatically. This table tells you how many cases fall into each class interval. To do this:
- Click on the “Analyze” menu at the top.
- Select “Descriptive Statistics.”
- Choose “Frequencies.”
- Move your variable into the variable box.
- Click “Charts” and select “Histograms.”
- Click “Continue” and then “OK.”
SPSS will now produce a frequency table and a basic histogram. This gives you a preview of what your frequency polygon will look like.
Quick Tips For Data Prep
- Always check for missing values before creating any graph.
- Make sure your class intervals are equal in width.
- Label your variables clearly so the chart makes sense later.
- Save your data file before making any changes.
Step-by-Step: How Do I Create A Frequency Polygon In SPSS
Now for the main event. This is where you learn exactly how to create a frequency polygon in SPSS from start to finish. Follow each step carefully, and you will have a professional-looking graph in just a few minutes.
Step 1: Open The Chart Builder
The SPSS Chart Builder is your best friend for this task. It gives you a drag-and-drop interface that makes graphing easy. Here is how to access it:
- Click on the “Graphs” menu at the top of the screen.
- Select “Chart Builder.”
- A new dialog box will open with a gallery of chart types on the left side.
You will see many chart options here. Look for the “Line” category. Click on it to expand the choices.
Step 2: Select The Line Chart Type
Inside the Line category, you will see several options. Choose the simple line chart. It looks like a basic line graph with a single diagonal line. Drag this chart type into the chart preview area in the center of the dialog box.
The preview area is blank at first. That is normal. You are about to fill it with your data.
Step 3: Assign Your Variables
On the left side of the Chart Builder dialog, you will see your variables listed. You need to assign two things:
- X-Axis: Drag your midpoint or class interval variable to the X-Axis box.
- Y-Axis: Drag your frequency variable to the Y-Axis box.
As you drag each variable, you will see the chart start to take shape in the preview area. The points should appear along the line.
Step 4: Add The Frequency Data
If you have not already created a frequency variable, SPSS can help. Go back to the “Analyze” menu, choose “Descriptive Statistics,” then “Frequencies.” Ask SPSS to compute the frequencies for your variable. This creates a new frequency count that you can use in your chart.
Once your frequency variable is ready, drag it into the Y-Axis box in the Chart Builder. Your line should now connect the midpoints of each class interval at the correct frequency height.
Step 5: Finalize And Generate The Chart
Review your chart in the preview area. Make sure the line looks smooth and the axes are labeled correctly. When you are happy with how it looks:
- Click “OK.”
- SPSS will generate the frequency polygon in a new output window.
- Your chart is now ready to view, save, or export.
That is really all there is to it. You have just created a frequency polygon in SPSS using the Chart Builder. It only takes a few minutes once you know the steps.
Customizing And Formatting Your Polygon
A basic frequency polygon is good. A well-formatted one is great. SPSS gives you many options to make your chart look polished and professional. Here is how to take your graph to the next level.
Changing Line Style And Color
Double-click on your chart in the output window. This opens the Chart Editor. In the editor, click on the line itself. A properties panel will appear on the side. From there, you can:
- Change the line color to make it stand out.
- Adjust the line thickness for better visibility.
- Switch to a dashed or dotted line style if needed.
These small changes can make a big difference in how your graph is perceived. Use colors that are easy on the eyes and accessible to all readers.
Editing Axis Labels And Titles
Clear labels are essential for any statistical graph. In the Chart Editor, click on the axis labels or chart title to edit them. Make sure you include:
- A descriptive chart title that explains what the graph shows.
- X-axis label that names the variable or class interval.
- Y-axis label that says “Frequency” or “Count.”
Good labeling makes your chart self-explanatory. Anyone who sees it should understand what the data represents without needing a long explanation.
Adding Multiple Lines For Comparison
One of the biggest strengths of a frequency polygon is the ability to compare groups. To add a second line:
- In the Chart Builder, drag a second variable into the “Set color” or “Cluster” box.
- SPSS will automatically draw a separate line for each group.
- Use the Chart Editor to assign different colors to each line.
This is incredibly useful when you want to compare, for example, test scores between two classes or responses from two different survey groups.
Quick Tips For Formatting
- Keep your color palette simple and consistent.
- Use gridlines sparingly to avoid clutter.
- Always export your chart as a high-resolution image for reports or presentations.
- Save your chart template if you plan to create similar graphs in the future.
Comparing Frequency Polygons With Histograms In SPSS
Both frequency polygons and histograms display the same underlying frequency distribution. But they do it in different ways. Understanding the differences helps you choose the right chart for your data.
When To Use A Histogram
Histograms are best when you want to emphasize the area under the curve. They are great for showing the shape of a distribution at a glance. If your audience is not familiar with statistical graphs, a histogram is often the safer choice.
When To Use A Frequency Polygon
Frequency polygons shine when you need to compare multiple data sets. They are also better for showing trends over time or across categories. Because they use lines instead of bars, they take up less space and feel cleaner on the page.
Side-By-Side Comparison
| Feature | Histogram | Frequency Polygon |
|---|---|---|
| Visual Style | Bars | Connected points with lines |
| Best For | Single data set | Comparing multiple groups |
| Trend Visibility | Moderate | High |
| Space Used | More | Less |
| Ease Of Reading | Very easy | Easy once you understand lines |
| SPSS Creation | Quick | Quick |
In most cases, a frequency polygon in SPSS gives you more flexibility and a cleaner look. It is especially useful when you are presenting grouped data or descriptive statistics in a research paper or professional report.
Common Mistakes To Avoid
Even experienced SPSS users make mistakes when building frequency polygons. Knowing what to watch out for saves you time and keeps your data accurate.
Skipping Midpoints
The most common error is forgetting to calculate midpoints for each class interval. A frequency polygon plots points at the midpoint of each interval. If you skip this step, your line will not align with the correct values on the X-axis.
Using Unequal Class Intervals
SPSS can handle unequal intervals, but the resulting polygon can be misleading. Always try to use equal-width intervals for a fair representation of your frequency distribution.
Forgetting To Label Axes
An unlabeled graph is a useless graph. Always double-check that your X-axis and Y-axis have clear, descriptive labels. This is especially important if you plan to share your chart with others.
Overloading The Chart
It is tempting to add too many lines or variables to one graph. This creates clutter and makes the chart hard to read. Stick to two or three lines at most. If you have more groups, consider creating separate charts.
Expert Insight
Many data analysts recommend creating a rough sketch on paper before building the chart in SPSS. This helps you plan the layout and decide which variables to include. It also saves time when you are inside the Chart Builder, because you already know what you want the final graph to look like.
Expert Tips For Better SPSS Charts
Once you have mastered the basics of creating a frequency polygon in SPSS, you can start refining your skills. These expert tips will help you produce charts that look professional and communicate your findings clearly.
Use Themes For Consistent Styling
SPSS allows you to apply chart themes that control colors, fonts, and line styles all at once. To access themes, go to the Chart Editor and look for the “Properties” panel. Choose a theme that matches the style of your report or presentation.
Export In Multiple Formats
When you are ready to share your chart, export it in the format that best suits your needs. PNG works well for documents and slides. PDF is better for print materials. SVG is ideal if you need a scalable vector image that stays sharp at any size.
Combine Charts For A Complete Picture
Sometimes one graph is not enough. Consider creating a frequency polygon alongside a histogram or a box plot. Together, these charts give your audience a full understanding of the data visualization story you are telling.
Keep A Template File
If you regularly create similar charts, save a template file with your preferred settings. This includes axis labels, color schemes, and formatting choices. Using a template saves you time and ensures consistency across all your SPSS outputs.
Quick Tips Summary
- Always label your axes clearly.
- Use equal class intervals for accurate representation.
- Limit the number of lines to keep the chart readable.
- Export charts in high resolution for professional use.
- Save your Chart Builder settings as a template for future use.
- Review your graph for accuracy before including it in any report.
Conclusion
Creating a frequency polygon in SPSS is a skill that pays off in both academic and professional settings. You now know how to prepare your data, use the Chart Builder, assign variables, and format your chart for maximum impact. The process is straightforward once you understand the steps, and the results are well worth the effort.
Remember that a good graph tells a story. Your frequency polygon should make it easy for anyone to see patterns, compare groups, and understand the frequency distribution in your data. Take the time to label your axes, choose clear colors, and review your work before sharing it.
Now that you know the full process, try it yourself with your own data set. The more you practice, the more confident you will become. SPSS is a powerful tool, and the frequency polygon is just one of many ways to bring your numbers to life. Start building your charts today and see the difference clear visualization can make.
Frequently Asked Questions
Can I Create A Frequency Polygon In SPSS Without Using The Chart Builder?
Yes, you can. You can also create a frequency polygon by first generating a histogram and then converting it. However, the Chart Builder method is faster and gives you more control over the final appearance. Most users find the Chart Builder approach easier and more flexible for creating a frequency polygon in SPSS.
What Type Of Data Works Best For A Frequency Polygon?
Frequency polygons work best with continuous or ordinal data that has been grouped into class intervals. They are ideal for showing how values are distributed across a range. If your data has clear midpoints and frequencies, a frequency polygon in SPSS will display it effectively.
How Do I Add A Second Line To Compare Two Groups?
In the Chart Builder, simply drag a second variable into the “Set Color” box. SPSS will automatically draw a separate line for each group. You can then use the Chart Editor to assign different colors and line styles to each polygon for easy comparison.
Is A Frequency Polygon The Same As A Line Graph?
They look similar, but there is a difference. A line graph can plot any two variables against each other. A frequency polygon specifically shows the midpoints of class intervals plotted against their frequencies. This makes it a specialized type of line graph designed for statistical data.
Can I Export My Frequency Polygon From SPSS?
Absolutely. Once your chart appears in the output window, you can right-click on it and choose “Export.” Select your preferred format such as PNG, PDF, or SVG. This makes it easy to include your frequency polygon in SPSS charts in reports, presentations, or research papers.
What Should I Do If My Frequency Polygon Looks Wrong?
First, check your data for errors or missing values. Make sure your class intervals are equal and your midpoints are calculated correctly. Also verify that you assigned the right variables to the X-axis and Y-axis in the Chart Builder. A quick review of your frequency table often reveals the issue.