Elements Of Ms Excel Everything You Must Know Today
The Elements Of Ms Excel form the foundation of one of the most powerful spreadsheet tools in the world. From the ribbon and toolbar to workbooks, worksheets, and formulas, understanding these core components helps you work faster and smarter. This guide walks you through every essential element, with practical tips and examples you can use right away.
Have you ever opened Microsoft Excel and felt a little lost? You are not alone. The screen is packed with buttons, tabs, and menus. But here is the good news. Once you understand the basic Elements Of Ms Excel, everything starts to make sense. This guide breaks down every core component in simple, easy-to-follow language. Whether you are a complete beginner or someone who wants to sharpen your skills, you will find practical value here.
Excel is more than just a grid of cells. It is a powerful tool used by millions of people around the world. Accountants, marketers, teachers, and scientists all rely on it daily. The key to unlocking its full potential lies in understanding its building blocks. In this article, we will explore every important element step by step. You will learn what each part does and how to use it effectively. Let us dive right in.
Key Takeaways
- The Excel ribbon and toolbar give you quick access to all the tools you need for everyday tasks.
- Workbooks, worksheets, and cells are the building blocks where all your data lives and gets organized.
- Formulas and functions let you crunch numbers, automate calculations, and save hours of manual work.
- Formatting options like conditional formatting and cell styles make your data easy to read and visually appealing.
- Charts and pivot tables turn raw data into clear visuals and meaningful insights.
- Keyboard shortcuts and the quick access toolbar boost your speed and productivity significantly.
- Practicing daily with real-world tasks is the best way to master all the Elements Of Ms Excel.
📑 Table of Contents
What Are the Elements Of Ms Excel
Before we go deeper, let us define what we mean by the Elements Of Ms Excel. These are the core components that make up the Excel environment. Each element serves a specific purpose. Together, they create a complete system for managing and analyzing data. Think of them as the parts of a car engine. Every piece has a job. And when they all work together, the engine runs smoothly.
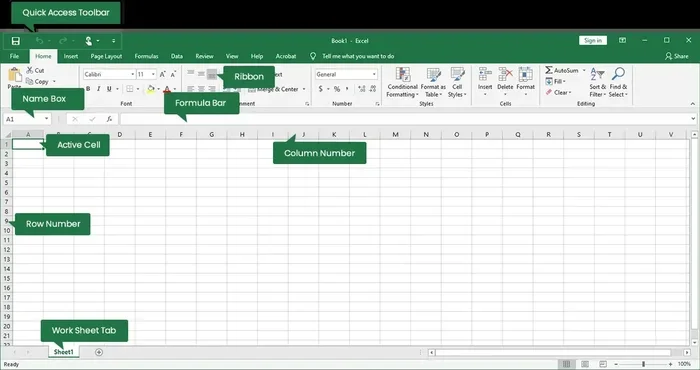
The main elements include the ribbon, the formula bar, the quick access toolbar, workbooks, worksheets, cells, and the status bar. Each of these plays a vital role. Some help you navigate. Others help you create and format data. And some help you analyze and visualize information. Let us look at each one in detail.
The Excel Ribbon
The ribbon sits right at the top of the Excel window. It is the main navigation hub. It contains multiple tabs, and each tab holds a group of related tools. For example, the Home tab has formatting tools. The Insert tab lets you add charts and tables. The Data tab gives you tools for sorting and filtering.
The ribbon has changed over the years, but its purpose stays the same. It gives you fast access to almost every feature in Excel. You do not need to memorize commands. Just find the right tab and look for the tool you need. The ribbon also adapts to your screen size. On smaller screens, it may collapse into smaller icons. But the functionality remains identical.
The Formula Bar
The formula bar is located just below the ribbon. It shows the contents of the active cell. When you click on a cell, whatever is inside it appears here. If the cell contains a formula, the formula bar displays the actual formula, not just the result.
This is a very important element of Excel. It lets you see exactly what is happening behind the scenes. For instance, if cell A1 contains the formula =B1+C1, the formula bar will show that exact text. This makes debugging much easier. You can spot errors quickly and fix them without guessing.
The Quick Access Toolbar
The quick access toolbar sits above the ribbon by default. It is a small, customizable toolbar that gives you one-click access to your most used commands. Common buttons include Save, Undo, and Redo. But you can add any command you want.
This is one of the most underrated elements of Ms Excel. Many users never bother to customize it. But doing so can save you a lot of time. If you use a specific feature every day, add it to this toolbar. You will wonder how you ever worked without it.
Workbooks, Worksheets, and Cells
Now let us move into the heart of Excel. The basic structure of any Excel file revolves around three elements: workbooks, worksheets, and cells. Understanding how they relate to each other is essential for anyone learning Excel.
What Is a Workbook
A workbook is simply an Excel file. When you open Excel and create a new file, you are creating a workbook. You can think of a workbook as a binder. Inside that binder, you have multiple pages. Each page is a worksheet. A single workbook can contain many worksheets. Most users start with one workbook and add more sheets as needed.
Workbooks help you organize related data in one place. For example, you might have a workbook for your monthly budget. One sheet could track income. Another could track expenses. A third could show summaries. All of this lives inside a single file. That makes it easy to manage and share.
What Is a Worksheet
A worksheet is a single page inside a workbook. It is made up of a grid of columns and rows. Columns are labeled with letters like A, B, and C. Rows are labeled with numbers like 1, 2, and 3. Where a column and row meet, you get a cell. Each cell has a unique address called a cell reference. For example, the cell at column A, row 1 is called A1.
Worksheets are where you enter and manipulate data. You can type text, numbers, dates, and formulas into cells. You can also format cells, add colors, and apply borders. A single worksheet can hold over a million rows and more than 16,000 columns. That is more than enough space for most projects.
Understanding Cells and Cell References
Cells are the smallest units in Excel. Every piece of data you work with lives inside a cell. You can put text in one cell, a number in another, and a formula in a third. Cells can also be formatted in countless ways. You can change the font, size, color, and alignment.
Cell references are crucial for building formulas. When you write a formula like =A1+B1, you are telling Excel to add the values in cells A1 and B1. You can reference cells on the same worksheet or even on different worksheets within the same workbook. This flexibility is one of the reasons Excel is so powerful for data analysis and reporting.
Formulas and Functions
If there is one thing that makes Excel truly special, it is formulas and functions. These elements of Ms Excel let you perform calculations automatically. Instead of doing math by hand, you let Excel do the heavy lifting. This saves time and reduces errors.
What Is a Formula
A formula is an equation you write yourself. It always starts with an equals sign (=). After the equals sign, you type the calculation you want Excel to perform. For example, =A1+B1 tells Excel to add the values in cells A1 and B1.
Formulas can be as simple or as complex as you need them to be. You can combine multiple math operations in one formula. You can also reference cells across different worksheets. The key is to understand the basic math operators. These include plus (+), minus (-), asterisk (*) for multiplication, and forward slash (/) for division.
What Is a Function
A function is a pre-built formula that Excel provides. Instead of writing out a long calculation, you use a function with a short name. For example, the SUM function adds a range of cells. Instead of typing =A1+A2+A3+A4, you can simply type =SUM(A1:A4).
There are hundreds of functions in Excel. Some of the most commonly used ones include:
- SUM adds a range of numbers.
- AVERAGE calculates the mean of a range.
- COUNT counts the number of cells with numbers.
- IF performs a logical test and returns one value for true and another for false.
- VLOOKUP searches for a value in the first column of a table and returns a value from another column.
- MAX and MIN return the largest or smallest value in a range.
Learning even a handful of these functions will transform how you work with data. Start with the basics and gradually add more to your toolkit. You will be surprised at how quickly your efficiency improves.
Nested Functions and Array Formulas
As you grow more comfortable, you can explore nested functions. A nested function is when you use one function inside another. For example, =IF(AVERAGE(B1:B10)>50,”Good”,”Needs Improvement”) uses the AVERAGE function inside the IF function. This allows for more complex and powerful calculations.
Array formulas are another advanced element of Excel. They let you perform multiple calculations on one or more items in an array. While they can seem intimidating at first, they are incredibly useful for tasks like counting unique values or matching data across multiple columns.
Formatting and Data Visualization
Raw data can be hard to read. That is where formatting and data visualization come in. These elements of Ms Excel help you present your data in a clear, professional, and visually appealing way.
Cell Formatting Basics
Excel offers a wide range of formatting options. You can change the font style, size, and color. You can add borders and fill cells with background colors. You can also align text horizontally and vertically within a cell. These small changes make a big difference in how your spreadsheet looks and how easy it is to read.
Number formatting is especially important. You can format cells to display currency, percentages, dates, and times. For example, you might enter the number 0.15 in a cell, but format it to display as 15%. The actual value stays the same, but the presentation changes. This is a small detail that makes a huge impact on clarity.
Conditional Formatting
Conditional formatting is one of the most powerful features in Excel. It allows you to automatically change the appearance of cells based on their values. For example, you could set a rule to highlight any cell with a value greater than 100 in green. Cells below 50 could turn red.
This is incredibly useful for spotting trends and outliers at a glance. You do not have to scan every single cell manually. Excel does the work for you. Conditional formatting works with numbers, dates, and even text. It is a must-have tool for anyone working with large datasets.
Charts and Graphs
Charts turn raw numbers into visual stories. Excel supports many chart types, including bar charts, line charts, pie charts, and scatter plots. Each chart type is best suited for different kinds of data and messages.
Bar charts are great for comparing categories. Line charts show trends over time. Pie charts display parts of a whole. Scatter plots help you identify relationships between two variables. Choosing the right chart type makes your data easier to understand and more impactful in presentations.
To create a chart, simply select your data and go to the Insert tab. Excel will suggest chart types based on your data. You can then customize colors, labels, and titles to match your needs. Charts are one of the most effective ways to communicate insights from your Excel spreadsheet data.
Pivot Tables
A pivot table is one of the most valuable tools in Excel. It lets you summarize large amounts of data quickly. You can group data, calculate totals, averages, and counts, and rearrange the layout with just a few clicks.
For example, imagine you have a sales dataset with hundreds of rows. A pivot table can instantly show you total sales by region, by product, or by month. You do not need to write any formulas. Excel does all the calculations for you. Pivot tables are a game-changer for anyone who works with large datasets regularly.
Keyboard Shortcuts and Productivity Tools
One of the best ways to get better at Excel is to use keyboard shortcuts. They help you navigate and perform tasks much faster than using the mouse. Here are some essential shortcuts every user should know:
- Ctrl + C copies the selected cell or range.
- Ctrl + V pastes copied content.
- Ctrl + Z undoes your last action.
- Ctrl + S saves the current workbook.
- Ctrl + F opens the find and replace dialog.
- Ctrl + Home takes you to cell A1.
- Ctrl + End takes you to the last used cell.
- Ctrl + Shift + L toggles filters on and off.
- Alt + = quickly inserts the SUM function.
Learning even five or six of these shortcuts can dramatically speed up your workflow. Practice them daily until they become second nature. Over time, you will notice a significant boost in your productivity.
The Status Bar
The status bar is the thin strip at the very bottom of the Excel window. It displays quick information about your current selection. For example, if you highlight a range of numbers, the status bar will show the sum, average, and count of those numbers instantly.
You can also customize the status bar to show additional information. Right-click on the status bar and you will see a list of options. You can toggle features like zoom level, page layout, and macro recording. It is a small element, but it provides quick insights without needing to write any formulas.
Tips to Master the Elements Of Ms Excel
Now that you understand the core elements, here are some practical tips to help you master them faster.
- Start with the basics. Do not try to learn everything at once. Focus on navigation, data entry, and simple formulas first. Build a strong foundation before moving on to advanced features.
- Practice with real data. The best way to learn Excel is to use it. Take a real project or dataset and work with it. Apply what you learn in a practical context.
- Use online resources. There are countless free tutorials, videos, and courses available. YouTube, Microsoft support pages, and Excel community forums are great places to start.
- Customize your workspace. Add your favorite tools to the quick access toolbar. Pin your most used worksheets. Arrange your windows in a way that makes sense for your workflow.
- Learn from your mistakes. Excel has a powerful undo feature. Do not be afraid to experiment. If something goes wrong, just press Ctrl + Z and try again.
- Join a community. Connecting with other Excel users can accelerate your learning. You can ask questions, share tips, and discover new techniques you might not find on your own.
Mastering the Elements Of Ms Excel is not about memorizing every feature. It is about understanding how the pieces fit together and practicing regularly. Give yourself grace as you learn. Every expert was once a beginner. The key is to keep going and stay curious.
Common Mistakes to Avoid
Even experienced users make mistakes. Here are a few common ones to watch out for:
- Forgetting the equals sign. Every formula must start with =. Without it, Excel treats your entry as text, not a calculation.
- Hardcoding values in formulas. Instead of typing a number directly into a formula, reference a cell. This makes your spreadsheet easier to update and audit.
- Ignoring cell formatting. A cell might contain a number but display it as text. Always check your formatting to avoid unexpected results.
- Not saving frequently. Excel crashes can happen. Save your work often to avoid losing data.
- Overcomplicating things. Sometimes the simplest solution is the best one. Do not use a complex formula when a simple one will do the job.
By being aware of these pitfalls, you can avoid frustration and work more efficiently. Keep these tips in mind as you explore and practice the various elements of Excel.
Expert Insights on Learning Excel Effectively
Many professional Excel users agree that consistency beats intensity. Spending 20 minutes a day practicing Excel is far more effective than cramming for hours once a week. Small, regular sessions help you retain information and build muscle memory.
Another expert tip is to break down large tasks into smaller steps. For example, instead of trying to build a complete dashboard in one sitting, start by entering your data. Then add formatting. Then create charts. Then build a pivot table. Breaking things down makes the learning process feel manageable and less overwhelming.
Finally, do not underestimate the power of templates. Excel offers thousands of free templates for budgets, calendars, trackers, and more. Using templates is a great way to see how experienced users structure their spreadsheets. You can learn new techniques just by examining how someone else built their workbook.
Conclusion
The Elements Of Ms Excel are the foundation of everything you do in this powerful application. From the ribbon and formula bar to workbooks, worksheets, cells, and formulas, each element plays a vital role. Understanding these components gives you the confidence to tackle any data challenge. Start with the basics, practice regularly, and gradually explore more advanced features. With time and patience, you will become a proficient and confident Excel user. The skills you build today will serve you for years to come. So open Excel, start experimenting, and enjoy the journey of mastering this incredible tool.
Frequently Asked Questions
What are the basic Elements Of Ms Excel?
The basic elements include the ribbon, formula bar, quick access toolbar, workbooks, worksheets, cells, and the status bar. Each element serves a specific purpose in helping you navigate, enter, format, and analyze data. Together, they form the complete Excel environment.
How many worksheets can a single Excel workbook contain?
A single Excel workbook can contain as many worksheets as your computer memory allows. In older versions, the limit was 255 worksheets. Modern versions of Excel are limited only by available system resources. Most users find that 10 to 20 worksheets per workbook is a practical range.
What is the difference between a formula and a function in Excel?
A formula is an equation you create yourself, always starting with an equals sign. A function is a pre-built formula provided by Excel with a specific name and purpose. For example, =A1+B1 is a formula, while =SUM(A1:A10) uses the SUM function. Functions make complex calculations easier and faster.
How can I improve my Excel skills quickly?
The fastest way to improve is to practice daily with real-world tasks. Start with basic formulas and formatting, then gradually explore functions, pivot tables, and charts. Use keyboard shortcuts to speed up your workflow. Watching tutorials and joining Excel communities can also accelerate your learning significantly.
Why is conditional formatting important in Excel?
Conditional formatting automatically changes the appearance of cells based on their values. This makes it easy to spot trends, highlight important data, and identify outliers at a glance. It saves time and makes your spreadsheets more readable and professional without requiring manual formatting.
Can I customize the ribbon and quick access toolbar in Excel?
Yes, absolutely. You can customize both the ribbon and the quick access toolbar to suit your workflow. Right-click on either one and select Customize. You can add, remove, and rearrange commands to create a workspace that matches how you work. This personalization can significantly boost your productivity over time.
=== CONCLUSION ===
The Elements Of Ms Excel are the building blocks of one of the most essential tools in modern work and education. By understanding the ribbon, formula bar, workbooks, worksheets, cells, formulas, and formatting tools, you gain the ability to manage, analyze, and present data with confidence. Remember to practice regularly, use keyboard shortcuts, and avoid common mistakes. With these foundations in place, you are well on your way to becoming an Excel pro. Start today, stay consistent, and watch your skills grow.