How Do I Create Control Charts In Excel Step By Step
This guide shows you exactly how do I create control charts in Excel for quality control. You’ll learn the step-by-step process to set up a control chart, add control limits, and interpret out-of-control signals. By the end, you’ll have a professional SPC chart ready to use.
Have you ever watched a production line and wondered if the process was really stable? You measure parts, jot down numbers, and hope for the best. But hoping is not a quality strategy. A control chart gives you a clear, visual way to see if your process is in control or drifting into trouble. And the best part? You can build one right inside Excel without any expensive software.
If you have been searching for how do I create control charts in Excel, you are in the right place. This guide walks you through every single step. We will cover everything from setting up your raw data to adding upper control limit and lower control limit lines. By the end, you will understand statistical process control and feel confident creating your own SPC charts.
Whether you work in manufacturing, quality control, or any field that tracks process data, this step-by-step guide will save you hours of guesswork. I will keep things simple and practical. No jargon. No fluff. Just clear instructions you can follow right now.
Key Takeaways
- You can build a control chart in Excel in under 10 minutes with just a few clicks and simple formulas.
- Control limits are not the same as specification limits — they come from your own process data and standard deviation.
- Recognizing out-of-control patterns like runs, trends, and cycles helps you catch problems early.
- Using Excel templates saves time and reduces errors when you need to make charts repeatedly.
- Automating your chart updates ensures your statistical process control data stays current without manual work.
- Common mistakes like misaligned data can throw off your mean line and control limits — always double-check.
📑 Table of Contents
What Is a Control Chart and Why Use It?
A control chart is a graph that plots your process data over time. It shows the mean line in the middle and control limits above and below it. These limits define the boundary of common cause variation — the natural, expected noise in any process. When a data point falls outside those limits, or when a pattern emerges, you know something special has happened.
You use a control chart to distinguish between common cause variation and special cause variation. Common cause is the steady, random noise you expect. Special cause is a signal that something changed — a machine wore out, a new operator started, or a material batch was different. Catching special causes early prevents defects and saves money.
Understanding Process Variation
Every process varies. That is a fact. The goal of statistical process control is not to eliminate all variation. That is impossible. The goal is to understand the type of variation you have. A control chart helps you do exactly that. When you see points within the limits and no patterns, your process is stable. When you see points outside or a run of seven on one side, you have a special cause to investigate.
Think of it like a thermostat. The temperature fluctuates a little around your set point. That is normal. But if the temperature suddenly spikes, you know something is wrong. A control chart works the same way for your process data.
Key Components of a Control Chart
Before you start building, you need to know the parts of a control chart:
- Center Line (CL) — This is the mean or average of your data. It sits right in the middle.
- Upper Control Limit (UCL) — A horizontal line above the mean, usually set at three standard deviations above.
- Lower Control Limit (LCL) — A horizontal line below the mean, three standard deviations below.
- Data Points — The individual measurements plotted over time.
- Time Order — Data is always plotted in the order it was collected. This shows trends and shifts.
When you know these parts, building the chart becomes much easier. You are just drawing lines and plotting dots. Excel does the heavy lifting.
Preparing Your Data in Excel
Good data makes a good control chart. If your data is messy, your chart will be misleading. Take a few minutes to organize your spreadsheet properly. This step is the foundation of statistical process control.
Collecting and Organizing Data
Start by collecting your measurements in a single column. Each row should be one observation, and the rows must be in time order. Do not sort them alphabetically or randomly. The sequence matters because a control chart reveals trends and shifts over time.
For example, if you measure the diameter of a machined part every hour, list the measurements in the order they were taken. Put the time or batch number in the first column and the measurement in the second. This simple structure works perfectly for a line chart.
Setting Up Your Excel Sheet
Here is a quick layout you can use:
- Column A: Sample Number or Time
- Column B: Measurement Value
- Column C (optional): Subgroup Identifier if you use subgroup data
Keep your data in a single data series. Avoid blank rows or merged cells. A clean, continuous range makes it easy to reference the data in formulas and charts. If you plan to update the chart regularly, leave extra rows below your current data so you can add new measurements without breaking the chart range.
Quick Tips for Data Entry
- Always use the same unit of measure for every data point.
- Record data immediately after collection to avoid memory errors.
- Double-check for typos — one bad number can shift your mean line and control limits.
- Use data validation in Excel to restrict entries to numbers within a reasonable range.
Common Mistakes: Many people enter data in a random order or mix different shifts together without labeling. This destroys the time sequence and makes the chart useless. Always keep your data in chronological order.
Step-by-Step: How Do I Create Control Charts In Excel
Now comes the fun part. I will show you exactly how do I create control charts in Excel using a simple line chart. The process has three main phases: insert the chart, calculate the limits, and add the limit lines. I will walk you through each phase with clear steps.
Insert a Line Chart
- Select your data range — both the time column and the measurement column.
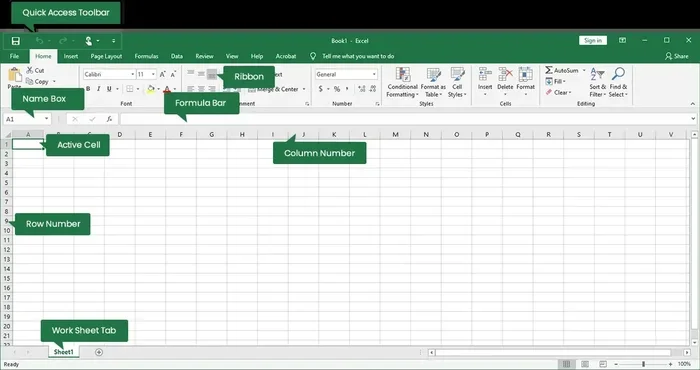
- Go to the Insert tab on the ribbon.
- Click Line Chart or Line with Markers in the Charts group.
- Choose the 2-D Line style. A basic chart appears on your sheet.
At this point, you have a run chart — just your data points connected by lines. It is a great start, but it does not yet have control limits. That is the next step.
Calculate the Mean and Control Limits
You need three values: the overall mean, the upper control limit, and the lower control limit. For an individuals control chart (also called an I-chart), the formulas are straightforward.
- Mean (Center Line): =AVERAGE(B2:B101) — replace B2:B101 with your actual data range.
- Standard Deviation: =STDEV.S(B2:B101) — this uses the sample standard deviation.
- Upper Control Limit (UCL): =Mean + (3 Standard Deviation)
- Lower Control Limit (LCL): =Mean – (3 Standard Deviation)
Put these formulas in empty cells near your data. Label them clearly. For example, put the Mean in cell D2, UCL in D3, and LCL in D4. You will reference these cells when adding the lines to the chart.
Expert Insight: The 3-sigma rule comes from normal distribution theory. For most process data, 99.73% of points should fall within three standard deviations of the mean. If your data is not normally distributed, you may need a different approach. But for most quality control applications, the 3-sigma limits work very well.
Add Control Limit Lines to the Chart
- Click on your chart to select it.
- Right-click on the plot area and choose Select Data.
- Click Add to create a new data series.
- For the Series Name, type “UCL”.
- For the Series Values, select the UCL cell and the cells below it for the same number of rows as your data. (You can also create a column of UCL values equal to the mean for each row.)
- Repeat for the Mean and LCL.
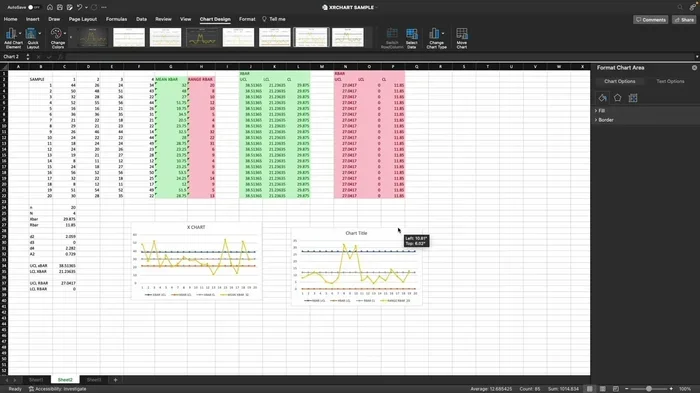
Once all three series are added, your chart will show three horizontal lines across the data. You can format them as solid lines with different colors. Make the UCL and LCL dashed lines so they stand out from the center line. This is the standard look for a control chart.
Quick Tips for Faster Setup
- Use named ranges for your Mean, UCL, and LCL cells. This makes formulas easier to read and update.
- Save the chart as a template so you can reuse it with new data.
- Lock the chart range by using Excel Tables. When you add new data to the table, the chart expands automatically.
Using Excel Tables is a game-changer. Select your data range, press Ctrl+T, and your data becomes a formal Table. Any chart linked to that Table will automatically include new rows. This is the easiest way to automate updates for your SPC charts.
Interpreting Your Control Chart
A control chart is only useful if you know how to read it. The chart tells a story about your process stability. You need to watch for signals that indicate something beyond common cause variation is happening.
Recognizing Out-of-Control Signals
The most obvious signal is a single data point outside the upper control limit or lower control limit. That point is a clear sign of a special cause. Investigate immediately. Look for a change in the process, a measurement error, or a new material.
But do not stop at single points. There are other patterns that suggest instability. These are sometimes called the Western Electric rules or the Nelson rules. They help you detect subtle shifts that a single point might miss.
Common Patterns to Watch For
- Run: Eight or more consecutive points on one side of the center line. This suggests a shift in the process mean.
- Trend: Six or more points steadily increasing or decreasing. This indicates a gradual drift, like tool wear.
- Cycle: A repeating up-and-down pattern over time. This often points to a periodic cause, like a temperature cycle or shift change.
- Stratification: All points clustered close to the center line with few near the limits. This can happen when data is mixed from different sources.
- Mixture: Points spread wide but with a gap near the center. This suggests two different process streams are combined.
When you see any of these patterns, do not ignore them. A control chart is a diagnostic tool. Use it to trigger investigation and process improvement. This is the core of Six Sigma and lean manufacturing thinking.
| Pattern | Signal | Likely Cause |
|---|---|---|
| Point beyond UCL or LCL | Special cause | Equipment failure, operator error, material defect |
| Run of 8+ on one side | Shift in mean | Tool wear, ambient temperature change, new batch |
| Trend of 6+ up or down | Drift | Gradual wear, calibration loss, slow contamination |
| Cycle | Periodic variation | Shift change, daily temperature cycle, machine warm-up |
| Stratification | Low variation | Data from multiple streams mixed together |
Use this table as a quick reference when you review your control charts. It will help you move from just looking at numbers to actually understanding your process.
Tips for Better Control Charts
Building a control chart is only the first step. To get real value from it, you need to maintain it properly and use it as part of a process improvement system. Here are some practical tips that make a big difference.
Using Excel Templates
Once you have built a chart you like, save it as a template. In Excel, right-click the chart tab and choose “Move or Copy.” Check “Create a copy.” You now have a reusable control chart layout with your formulas already in place. You can duplicate this for different products or lines and just paste new data.
Automating Updates with Dynamic Ranges
If you update your data daily or weekly, manual chart updates become tedious. Use an Excel Table as your data source. Tables automatically expand when you add rows. Your chart will include the new data points without any adjustment. This is the simplest form of automating updates for SPC tracking.
For even more power, you can use dynamic named ranges with the OFFSET function. But for most users, the Table method is more than enough. Keep it simple. The best control chart is one you actually use.
Avoiding Common Mistakes
- Using specification limits instead of control limits. Specification limits come from customer requirements. Control limits come from your process data. They are completely different. Do not draw specification limits on a control chart unless you have a specific reason.
- Ignoring rational subgrouping. Your data should be collected in a logical subgroup order. Mixing data from different machines or shifts without labeling can hide important signals.
- Not recalculating limits after process changes. If you make a significant process improvement, you should recalculate your mean and control limits based on the new stable data.
- Overreacting to common cause variation. Not every point near the limit is a problem. Adjusting the process for common cause noise will actually make things worse. Only respond to special causes.
When to Use Different Chart Types
The individuals chart (I-chart) works well for single measurements. But if you collect data in subgroups, you might need an X-bar and R chart or an X-bar and S chart. The choice depends on subgroup size:
- Subgroup size 2-10: Use an X-bar and R chart.
- Subgroup size 11 or more: Use an X-bar and S chart.
- Individual measurements: Use an I-chart with a moving range chart.
Each chart type has its own formulas for the control limits. The principles remain the same. You plot the data, add the center line, and add the upper and lower limits. Excel can handle all of them once you understand the basic structure.
Conclusion
Creating a control chart in Excel is a practical, powerful skill. You do not need specialized software or a statistics degree. With a clean data set, a few simple formulas, and a line chart, you can build a statistical process control tool that gives you real insight into your process. You now know how to calculate the mean, set the upper control limit and lower control limit, and add them to your chart.
Remember that the goal is not just to make a chart. The goal is to use the chart to make better decisions. When you see a point outside the limits or a run of eight on one side, you have a signal to investigate. That is where process improvement begins. Keep your data clean, update your chart regularly, and trust the control chart to guide you.
If you follow this step-by-step guide, you will be able to create professional SPC charts in Excel whenever you need them. Start with your own data today. See the difference a control chart makes. You will wonder how you ever managed without it.
Frequently Asked Questions
Can I create a control chart in Excel for free?
Yes, absolutely. You do not need any add-ins or paid software. Excel has built-in charting tools and formulas like AVERAGE and STDEV.S that are all you need. The entire control chart can be built with the standard version of Excel.
What is the difference between a control chart and a run chart?
A run chart is just your data points connected over time. It has no control limits. A control chart adds a center line and upper and lower control limits. The limits help you determine if a point is statistically unusual. So every control chart starts as a run chart, but adds the statistical boundaries.
How do I update my control chart when I add new data?
The easiest way is to use an Excel Table for your source data. When you add a new row to the Table, the chart automatically includes the new point. You can also just extend the data range in the chart if you are not using a Table. The key is to keep your data in a continuous, unbroken range.
What if my data is not normally distributed?
The 3-sigma control limits work well for most process data, even if it is not perfectly normal. However, if your data is highly skewed or has a lot of zeros, you may need to transform the data or use a different chart type, such as a individuals-moving range chart with a Box-Cox transformation. In many practical manufacturing settings, the standard approach still gives reliable results.
Can I use control charts for service processes, not just manufacturing?
Yes, control charts are used in any industry that tracks repeatable processes. You can use them for call center wait times, transaction processing times, website error rates, or healthcare wait times. The principle is the same: plot data over time, add limits, and look for signals. Process improvement applies everywhere.
Do I need to know Six Sigma to create a control chart?
No, you do not need any formal Six Sigma certification. The basic idea is simple: measure your process, calculate the average and limits, and watch for unusual patterns. Many people learn by doing. This guide gives you the hands-on steps to start right away. You can always deepen your knowledge later with formal training.